
|
When I started to learn OpenSees in 2013 it was challenging due to lack of a good documentation and any experienced user in our research group. It was really difficult for me with no coding background and being a user of Abaqus/SAP2000 for finite element analysis (with a great graphical user interface, GUI) to learn and appreciate a platform like OpenSees. I am sure a lot of new users double-click "OpenSees.exe" expecting to see something interesting but are greeted by a pitch dark window (Fig. 1). For a few months I kept trying my best to learn something that didn't look interesting to me. In 2014, I attended OpenSees Days (why this name?) in Berkeley that had workshops by Dr. Frank McKenna and many advanced users. That was the turning point. I was highly motivated by the work and examples they presented there. The most interesting parts were: parallel computing and visualization with GID+OpenSees. I remember after completion of my first OpenSees model, I felt like a programming ninja. 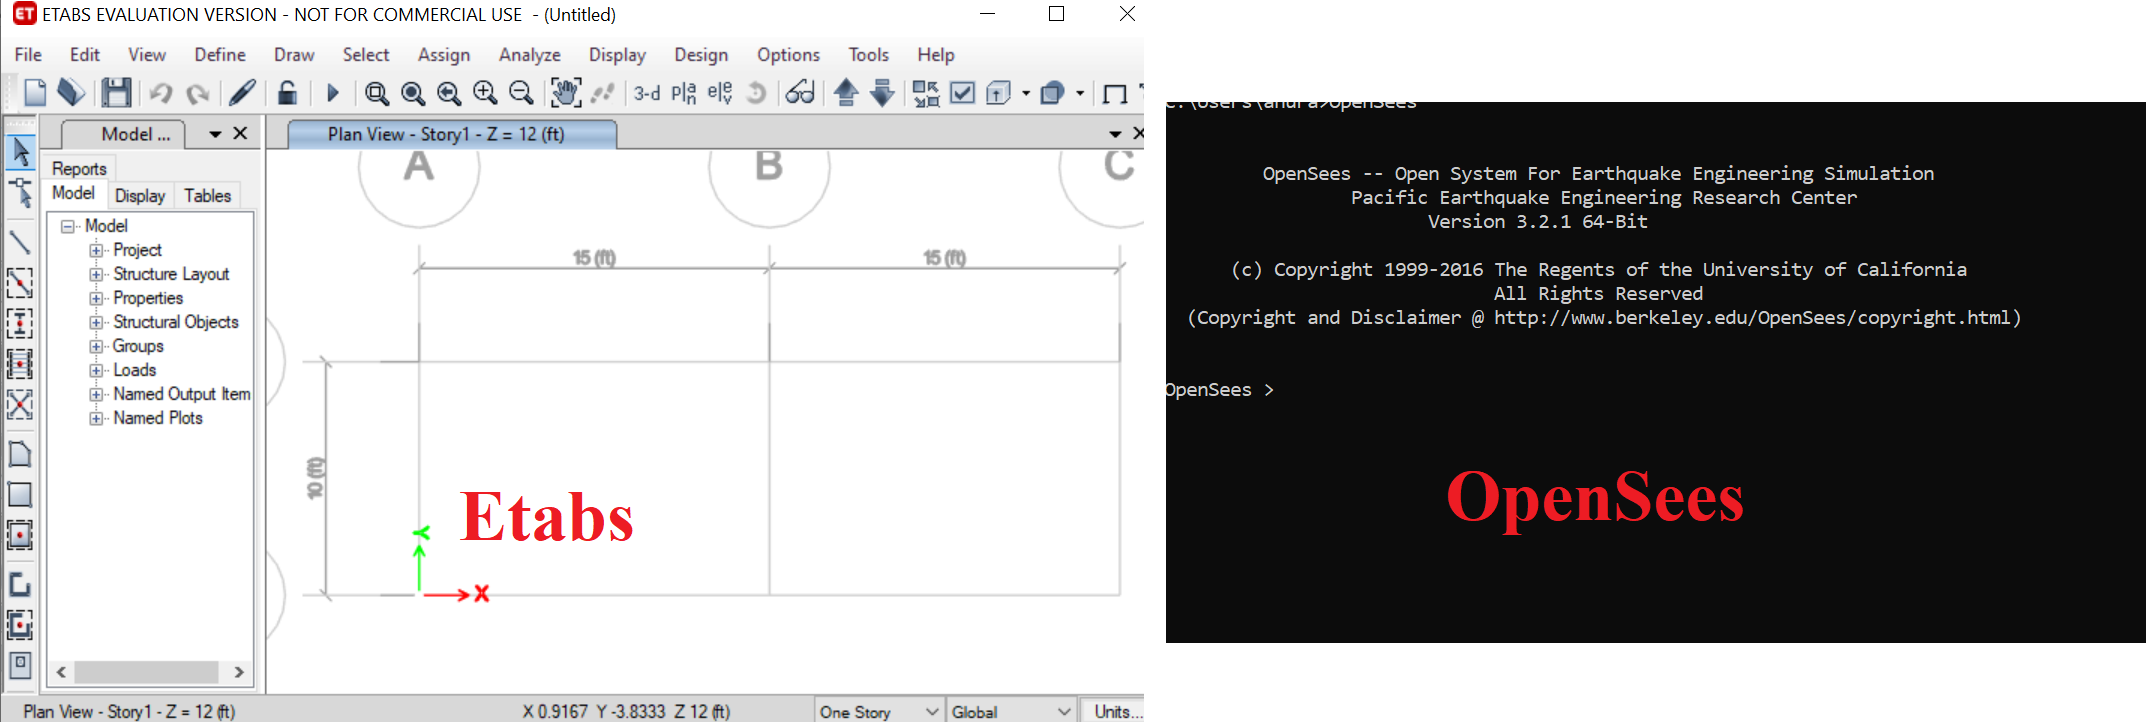 Fig. 1 Welcome screen of Etabs and OpenSees. Think before you start There is a popular slide by Dr. Frank Mckenna in one of his tutorials that says "THINK before you type". It means that the user should have a clear idea of what they are trying to model. Probably the best way is to draw on a paper the schema of the numerical model you are trying to build with node and element tags on it. I am sure it is valid for everything you do in your life. However, it is important to REALLY think before you start in situations where you are navigating through dark or you can not see the repercussions of your computer program. I know you all think I am talking about space programs where you have to land on the Moon. But that also applies for modeling in OpenSees.  Fig. 2 Think before you type. (McKenna , forever) Wait! Modeling in OpenSees should not be that difficult. I should not have to wait for my program to crash or produce some unrealistic results for me to realize I had some ill-connected nodes in my model. I always wanted a quick way to visualize the models I was creating for my research. Thanks to my old laptop, I was forced to switch to Linux and adopt Python as my primary plotting program. All opensource. This gave me a push to develop simple procedures that everyone can use to visualize their model. That was the start of OpenSeesPy visualization library Get_Rendering. Need to Visualize your OpenSees model Let me show you with an example how I found visualization of OpenSees model very helpful. Shown in Fig. 3, is a bridge model with all the parameters I thought were reasonable to apply in the model. The gravity analysis converged and the modal periods looked reasonable. Lift Off!!! (space shuttle launch.. anyone?). But then I started to check all the modeshapes and I realized something strange. Mode 1 looked like a good old lateral mode. However, mode 2 showed that my space shuttle launch had failed. I had to do a lot of digging in the model to figure out the bad actor and there you go. I get the correct 2nd Mode. 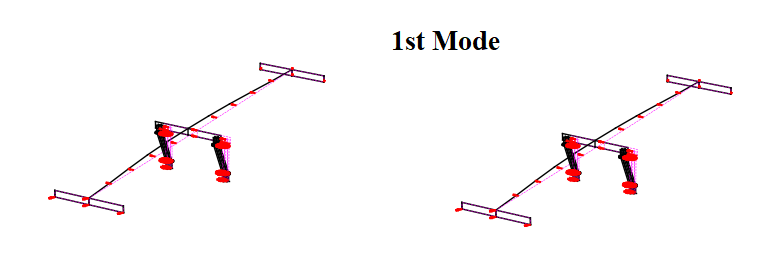 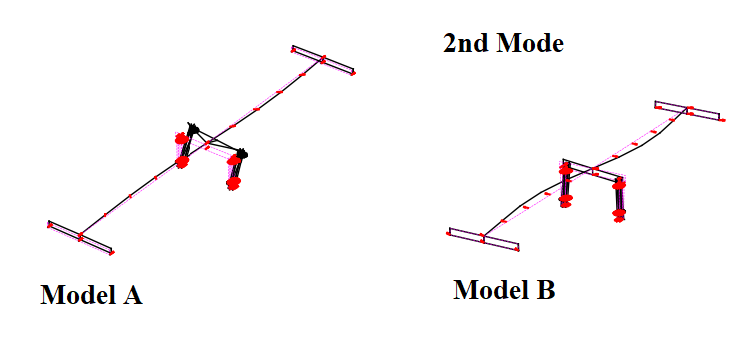 Fig. 3 Mode shapes of the bridge model.
Had I gone with the first model without checking the mode shapes, I would have either crashed the landing on the Moon or come back without landing. OpenSeesPy has some added visualization commands for users. You can visualize OpenSees model, modeshapes and deformed model with just a few commands. See the link below to learn more. https://openseespydoc.readthedocs.io/en/latest/src/plotcmds.html Comments are closed.
|
 RSS Feed